Graphing with Cardinals
Observe Cardinals together and graph your results!
Published on February 26, 2021

By Leah Farnham (teacher, mom, CMoR member)
Cardinals are the state bird of Virginia and a favorite of my toddler to spot outside. The males are bright red which makes them easy to see in the winter. The female Cardinal is also a beautifully-colored brown with red tinges.

Cardinals do not migrate and usually live within a mile of where they were born. Some people also believe that seeing a Cardinal is a reminder of a loved one who has passed. All of these things make me love seeing Cardinals on a cold winter’s day. I challenged my children to look for Cardinals for a whole week and then we graphed our data. Data collection is a unit of study in every elementary grade – why not give your child a head start by collecting your own data at home? Here is how we did it.
Cardinal Graphing Project
Materials
a chart for collecting your data during the week like the one below

toilet paper rolls to make “binoculars” (we made the cardinal ones below)

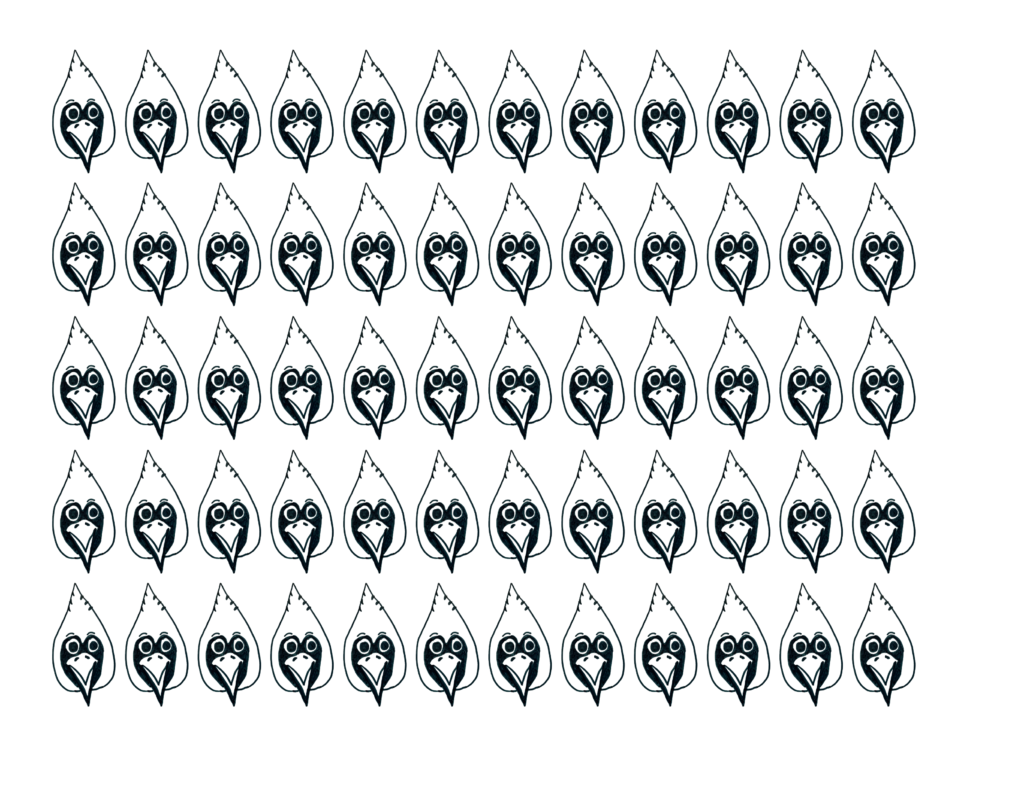
a copy of this Cardinal page to make your pictograph at the end of the week
Instructions
1. Watch for Cardinals each day for a week. We watched for 10-20 minutes after dinner each night.
2. Tally how many Cardinals you see each day using your chart. You can teach your child to tally while doing this. Teachers often say, “One, two, three, four, close the door” when teaching this skill. It helps to explicitly explain that the 5th mark is across the other four.
3. After you have collected your data, print a copy of the Cardinal image page and let your child color the Cardinals. My toddler enjoyed scribbling red across these pictures.
4. Create a pictograph together by placing one Cardinal picture for each Cardinal seen. My toddler loves to glue so you can see I did not worry about the images being straight or perfect on our graph.

5. Discuss your findings by asking questions like: What day did we see the most Cardinals? The least? Are there any days that we saw the same amount? How many Cardinals did we see in all?
*This can be adapted for older children in a few ways:
-Observe for longer periods of time or days.
-Use a key of 2 or 5 so that each picture represents more than one.
-Have them collect data about all of the birds seen, not just Cardinals.
-Ask questions like, how many more Cardinals did you see on Tuesday than Wednesday? How many did you see on Monday and Friday together?
This simple activity can open the door to so many great math conversations. While all areas of study are so important, math can be harder to embed into our conversations with children. Think of more ways you can include math talk into your time together. Cooking together, playing with calculators, weighing things, and counting are also great ideas!
Math at CMoR

If you enjoyed this activity, be sure to visit the Bank Exhibit at either CMoR location. Kids love pretending to be the banker and counting the wooden money. Challenge your children to name all of the coins in the display! When we show kids how math is used in our everyday lives, we place value on these concepts. Kids notice what is important and think more about these ideas.
I hope that you and your little mathematicians have a great time collecting data together. Be sure to share this post and your data with us on Facebook or Instagram. I would love to see your work!